
Poker Tournament Management App
Run Poker Tournaments Like a Pro!
From First Hand to Final Table
Seat draws, table balancing, the clock, payouts and league standings: Shuffle Up and Deal! runs the whole night from your iPhone or iPad.


Poker player statistics organisers actually need to track

Organiser-facing poker player statistics are the records you need to run, report and settle an event: attendance, entries, rebuys, standings, payout ledgers and season leaderboards. The fastest way to capture them accurately is a dedicated tournament-management app that logs registration, live standings and payouts as they happen, rather than a spreadsheet you patch together afterwards.
Two examples show the difference between raw numbers and organiser-ready data: an attendance count tells you who showed up, while a payout ledger entry tells you exactly what each finisher was owed and when it was paid. Scoring systems like the PokerStars Live League points formula show how structured tracking turns single events into a season. Shuffle Up and Deal! builds this into one workflow for tournament directors.
The essentials to track from your very first event:
- Attendance (registered vs checked-in)
- Entries, including rebuys and add-ons
- Total prize pool and payout ledger
- Finish position and ITM status per player
- Season or league points per event
Pro Tip: Settle disputes fast by cross-checking your live export against the payout ledger timestamp, not memory. Whoever edited the record last should be identifiable in one click.
Key Takeaways
Accurate organiser-facing statistics depend on capturing attendance, entries, payouts and season points at the moment they happen, not reconstructing them afterwards.
| Point | Details |
|---|---|
| Track the core five | Attendance, entries, prize pool, ITM percentage and season points cover most organiser needs. |
| Weight buy-ins fairly | Apply tier multipliers so high-value events don’t unfairly dominate season standings. |
| Keep an auditable trail | Retain registration records, payout ledgers and final table placements for every event. |
| Publish standings fast | Post leaderboards within 24 hours and keep the points formula visible alongside them. |
| Use a dedicated app | Shuffle Up and Deal! covers smart seating, live standings, payouts and leaderboards in one workflow. |
Table of Contents
- Which poker player statistics matter and how do you calculate them?
- How do organisers actually use these statistics?
- How do you collect and maintain accurate player records?
- What dashboard and reports should every organiser have?
- What should you look for in tournament-management software?
- Implementation checklist for a single event
- Get organiser-ready stats without building your own system
- Sources
Which poker player statistics matter and how do you calculate them?
Not every number is worth tracking. Organisers need metrics that feed three things: leaderboards, payouts and season reports. Here’s the shortlist and how each one is worked out.
- Attendance: registrations versus players who actually checked in. The gap between the two tells you how reliable your sign-up process is.
- Entries: initial buy-in plus rebuys plus add-ons. This is your real field size, not just the seats filled at the first level.
- Total prize pool: entries multiplied by buy-in value, plus any bounty or add-on contributions.
- Average finish: a player’s mean placement across a season, useful for ranking consistency rather than one lucky night.
- Cash rate: the percentage of events a player finishes in the money.
- In-the-money (ITM) percentage: closely related to cash rate but tracked at event level for payout planning.
- Payout ledger balance: what’s been paid out versus what’s owed, reconciled after every event.
- Season points: the number that actually drives your leaderboard.
Buy-in weighting matters here. A low-tier £20 event and a high-tier £200 event shouldn’t earn identical points for the same finish, so most leagues apply a tier multiplier. Points can also be awarded for participation alone, not just cashing, which keeps casual players engaged across a season.
Statistic callout: if a player finishes 3rd in a high-tier event where the base points for 3rd place are 40, their season points for that event are calculated by applying the tier multiplier accordingly.
For audit purposes, always retain your registration transaction record, the full payout ledger, and final table placements for every event. These three records answer almost any dispute that comes up later.
How do organisers actually use these statistics?
Raw numbers only matter once they drive a decision. Leaderboards are the clearest example: scoring formulas shape player behaviour, so a volume-weighted system (points for every entry) tends to increase how often players show up, while a finish-weighted system pushes players to target specific, higher-value events. Choose the model that matches what you want your season to reward.

Tiered buy-in weighting, similar to the model used in the PokerStars Live League, lets you combine low, medium and high buy-in events into one season table without penalising players who stick to smaller games. Live leaderboards also give players an immediate, visible reason to keep entering, which is exactly why they’re worth publishing after every event, not just at season end.
Practical uses stack up quickly: monthly leaderboard prizes, satellite qualifier selections, or picking an ambassador based on season-long consistency rather than a single deep run. Attendance trends tell you which nights to run more often and when a buy-in needs adjusting.
Good communication habits:
- Publish standings within 24 hours of an event finishing.
- Show the points formula alongside the leaderboard, not buried in a separate document.
- Give players a single contact point for queries, not several conflicting sources.
Pro Tip: Lock your points formula for the whole season before it starts. Changing scoring mid-season, even with good intentions, is the fastest way to trigger accusations of manipulation.
How do you collect and maintain accurate player records?
Good statistics start with a clean process, not a clever spreadsheet formula. Build the habit in three phases.
- Pre-event: capture player profiles, take payments, and set late-registration cut-offs so entries close cleanly.
- Check-in: confirm attendance against your registration list and flag no-shows immediately.
- During the event: record rebuys and add-ons as they happen, keep table balancing live, and refresh standings after every break.
- Live exports: pull a snapshot export at each major stage, so you have a timestamped record to settle any dispute on the spot.
- Post-event: finalise payouts, reconcile the ledger against receipts, and archive the full event file.
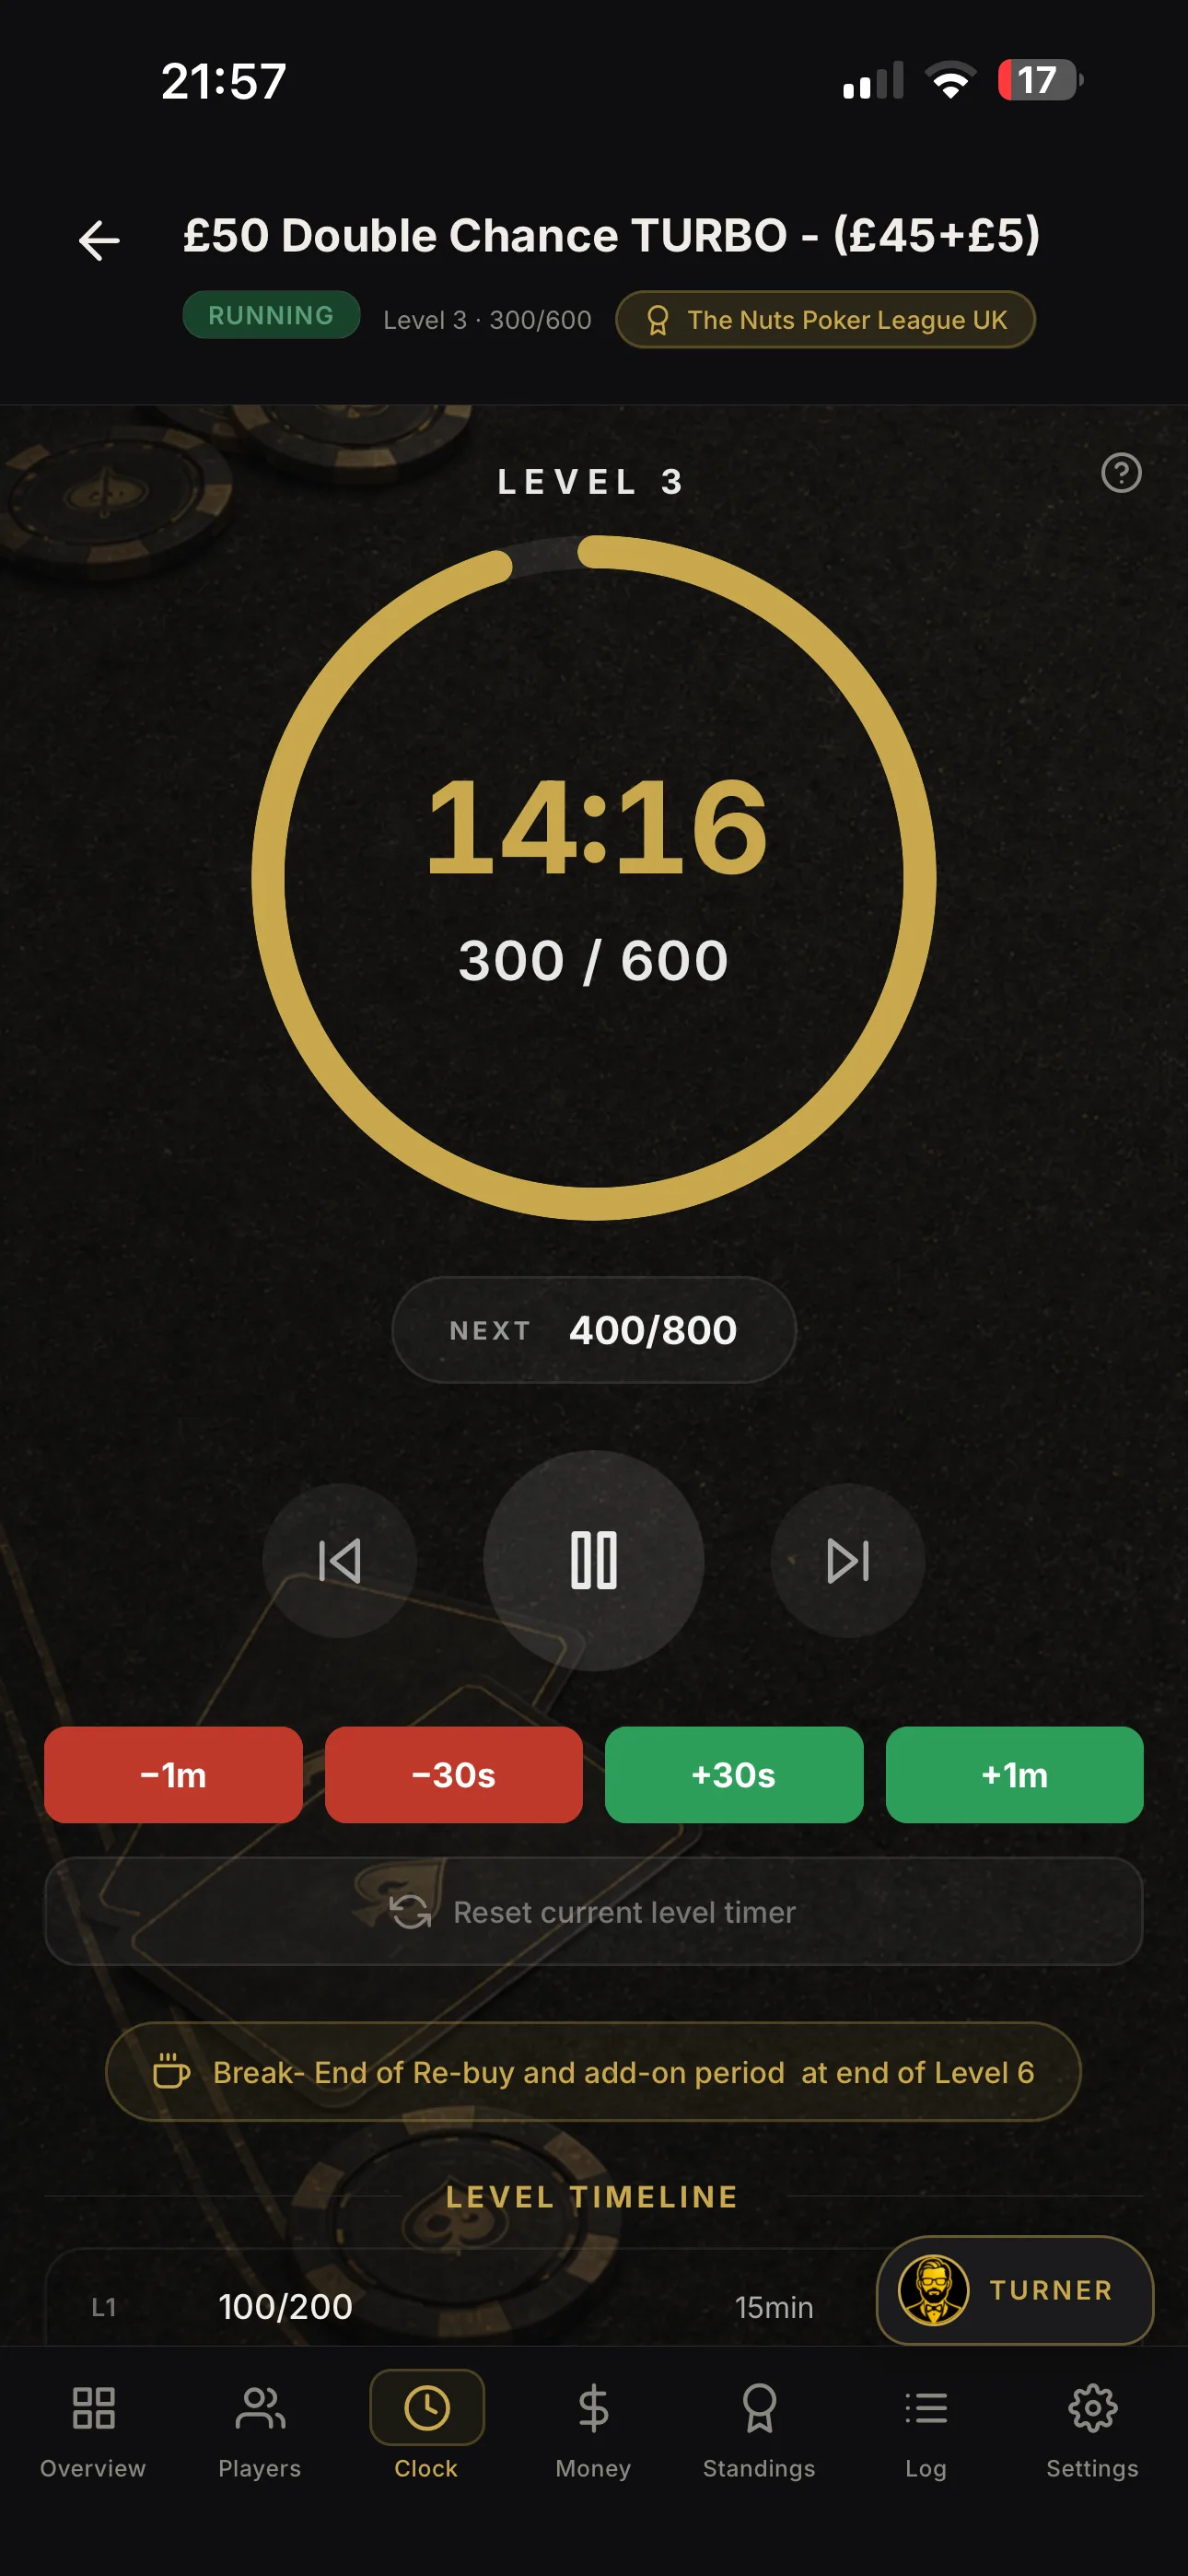
The seating chart display features that support table balancing during play also feed straight into your live standings, so check-in and table management aren’t separate jobs from stats tracking.
Pro Tip: Timestamp every edit and restrict who can change a finalised record. An auditable edit trail settles more disputes than any amount of explaining.
What dashboard and reports should every organiser have?
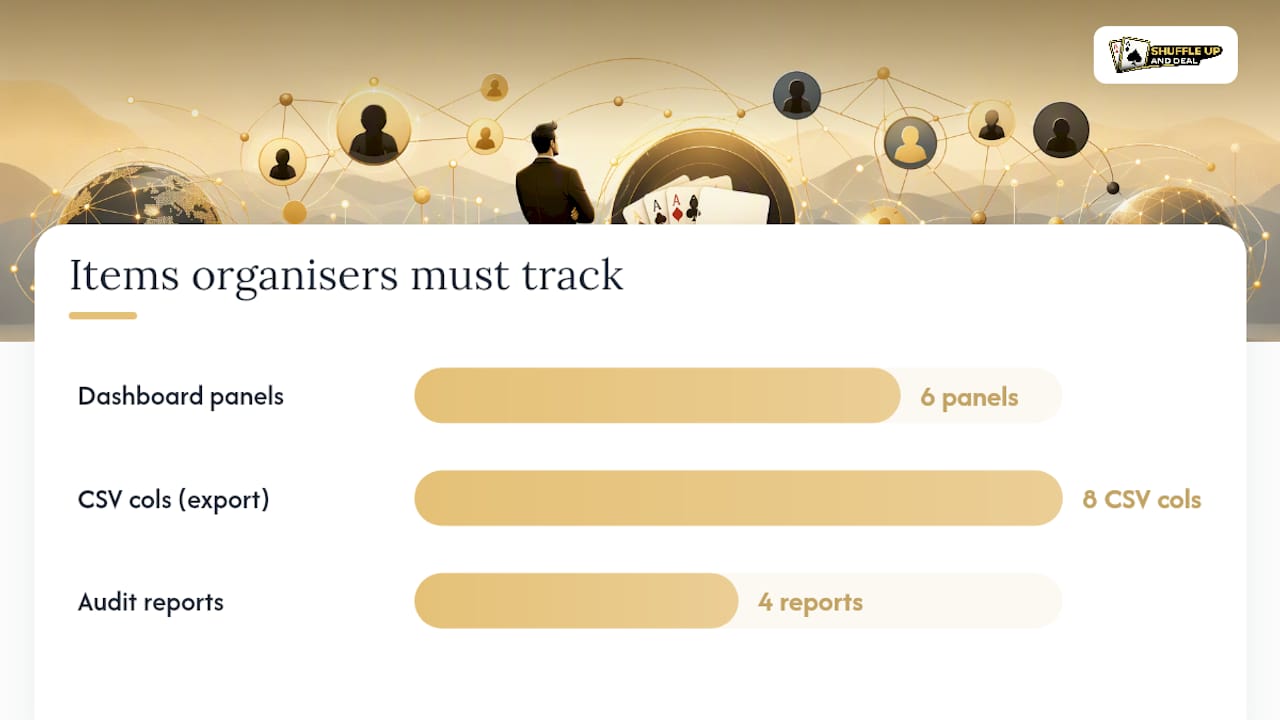
A working dashboard needs six panels: live standings, the current table map, the blind clock, the payout ledger, an attendance trend chart, and the season leaderboard. Miss any one of these and you’ll end up reconstructing it manually after the fact.
For exports, keep every event in a consistent CSV format so seasons stay comparable:
| Column | Description |
|---|---|
| event_id | Unique identifier for the event |
| player_id | Unique identifier for the player |
| name | Player’s full name |
| buy_in | Buy-in amount for the event |
| rebuys | Number of rebuys or add-ons taken |
| finish_position | Final placement in the event |
| payout_amount | Amount paid to the player |
| points_awarded | Season or league points earned |
Keep four reports on file for audits: the registration ledger, payment receipts, the payout reconciliation, and full leaderboard history. Public-facing leaderboard hub pages show how other live events design ranking displays, and the same idea works well cast to a screen at your venue or shared as a live link so players can check standings without pulling you away from running the clock.
What should you look for in tournament-management software?
Not every app on the market is built for organisers. Before you commit, check for these features and why each one earns its place.
- Smart seating: automates table balancing so you’re not manually shuffling players between breaks.
- Live clock: keeps blind levels accurate and synced across every display.
- Multi-device sync: lets you run registration on one device and the clock on another without records drifting apart.
- Automated payouts: calculates prize distribution against your payout table instantly.
- Rebuy and add-on handling: logs these as they happen instead of retrofitting them into totals later.
- Export formats: gives you clean CSVs for reconciliation and archives.
- External display casting: puts standings and the clock on a screen players can see without asking.
- Leaderboards and season management: tracks points across events automatically.
- ICM calculator: supports fair deal-making at final tables.
Pro Tip: If you’re running fewer than a handful of events a month, start on a free tier and only upgrade once you need multi-event season tracking or higher player limits.
Shuffle Up and Deal! maps directly onto this list: smart seating and live-clock features handle table management, leaderboards and season tools cover the scoring side, and payout tracking with rebuy controls, multi-device sync and an in-app ICM calculator round out the rest, as detailed on Shuffleup.
Implementation checklist for a single event
Pre-event: pre-fill player profiles, set your blind structure using a reference like the poker chip breakdown, define the payout table, enable leaderboard tiers, and confirm display casting is working.
During the event: run check-in against your registration list, record rebuys and add-ons live, keep standings updating, pull periodic exports, and timestamp any edits or disputes as they arise.
Post-event: finalise payouts, export receipts and the payout ledger, publish leaderboards, and archive the full event file for reconciliation.
Automation earns its keep hardest during the live phase: check-in, rebuy logging and standings updates are exactly where manual tracking falls apart under time pressure.
A tournament director’s note
Running live leaderboards and pulling instant exports has cut post-event admin dramatically and closed most disputes before they escalate. Keep detailed edit logs, ask for photo proof on cash transactions, and make every stat visible to players. Auditable, transparent records build trust faster than any prize pool does.
Get organiser-ready stats without building your own system
Shuffle Up and Deal! is the alternative to stitching together spreadsheets and messaging groups to run a season. It’s the tournament-management app that already handles the checklist above, so organisers spend their time running events instead of reconciling them afterwards.
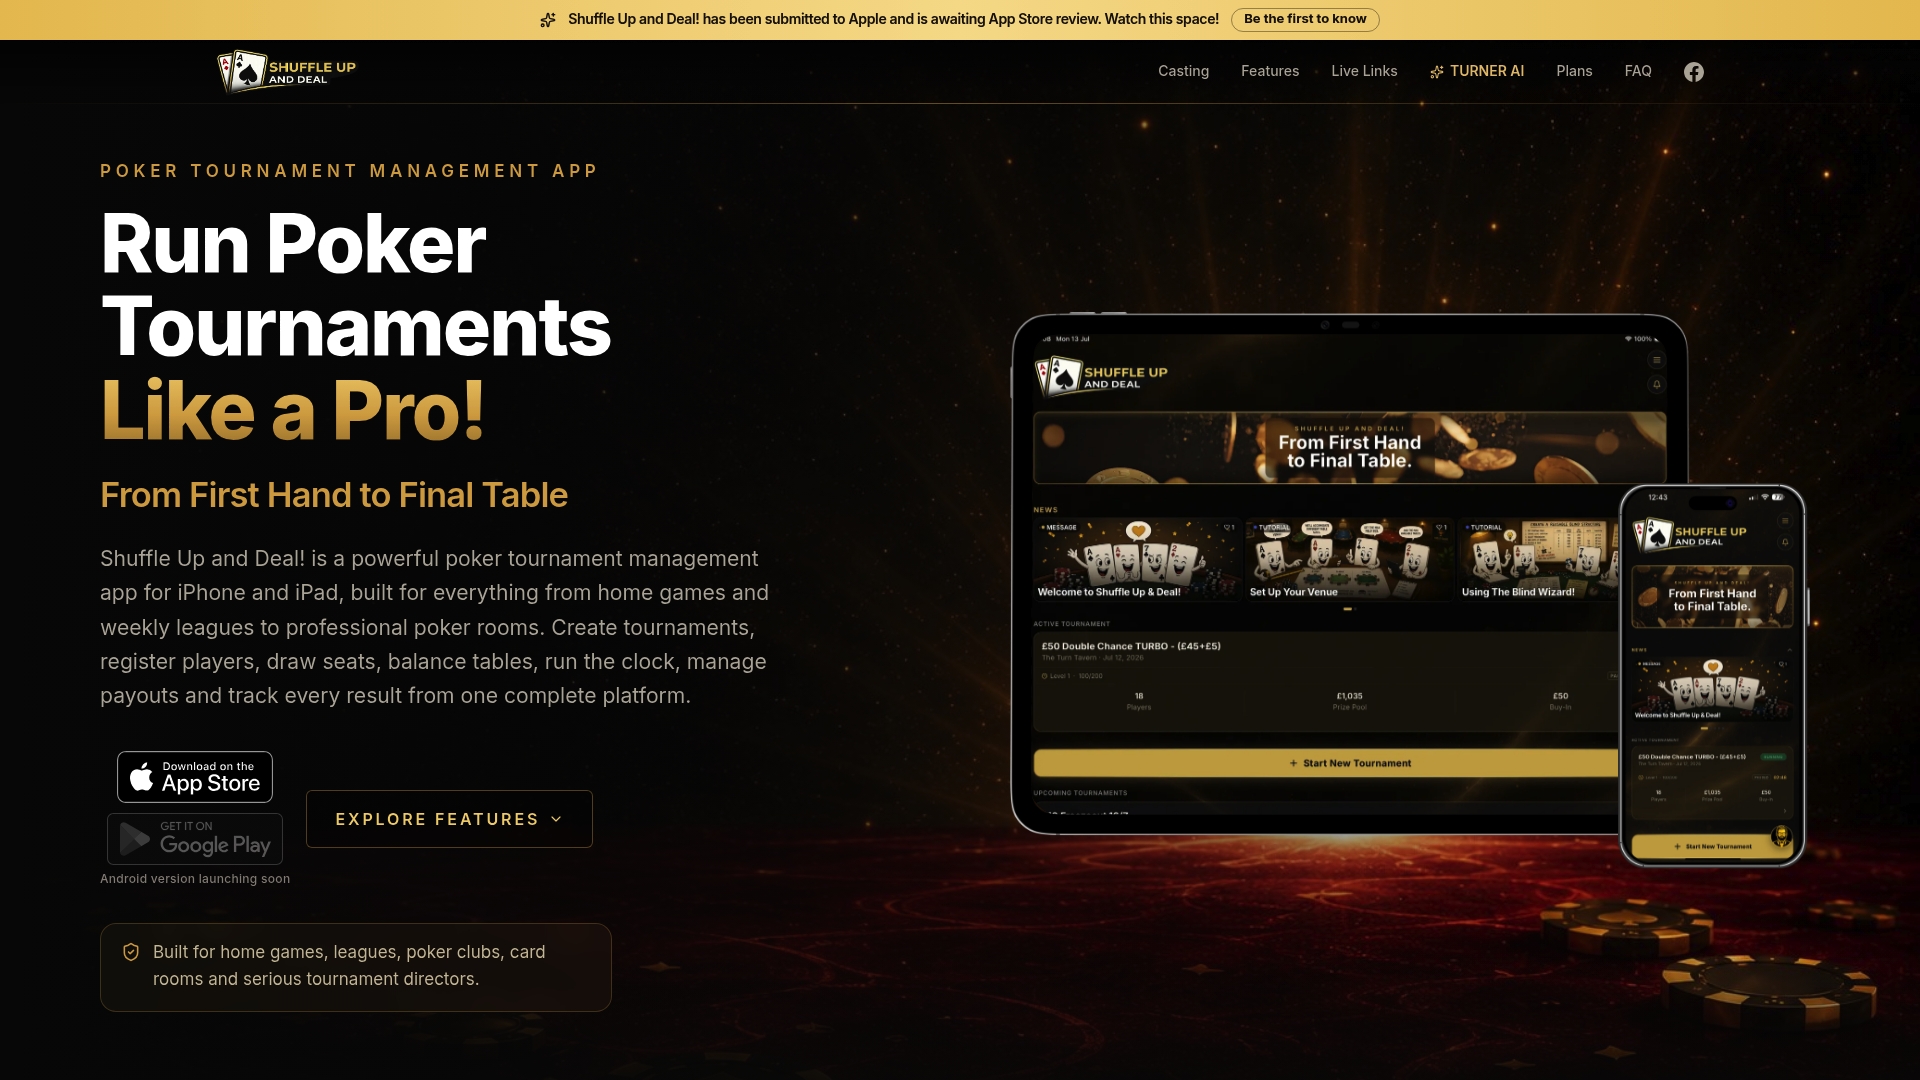
The feature set covers exactly what this guide has walked through:
- Smart seating and live table balancing
- A live tournament clock with external display casting
- Leaderboards and multi-tier season management
- Payout tracking with rebuy and add-on handling
- Multi-device sync so registration and clock never drift apart
- Export options for audits and reconciliation
- An in-app ICM calculator for final-table deals
Start on the free plan, set up your season, import your player list, and run one test event before your next scheduled night. It’s built for iPhone and iPad, so your registration desk and your floor display can run from separate devices without missing a beat. Head to the Shuffle Up and Deal! landing page to get your season set up.
Sources
For further reading on how leaderboards shape player behaviour and season design, explore the Railbird manifesto on measuring consistent results, and the analysis of scoring formula effects on player strategy. For planning a full season structure, see league season planning. To start tracking your own organiser stats, visit the Shuffle Up and Deal! landing page.
- Why Leaderboards Still Matter in Live Tournaments - Gamificationsummit
- Poker Leaderboards Explained: Effects on Player Behaviour
- PokerStars Live League - PokerStars news