Poker Tournament Management App
Run Poker Tournaments Like a Pro!
From First Hand to Final Table
Seat draws, table balancing, the clock, payouts and league standings: Shuffle Up and Deal! runs the whole night from your iPhone or iPad.


Poker tournament payouts: how to calculate them correctly
Most poker tournaments pay approximately the top 10–15% of the field, with first place usually receiving around a quarter to a third of the total prize pool, depending on how many entrants show up. That prize pool itself is simple maths: total buy-ins, minus rake, plus any rebuys or add-ons. Once you know your entrant count and your rake cut, you apply a percentage curve to that number and the payouts fall out the other end.
TL;DR:
- Most tournaments pay 10% to 15% of the field, with first place often receiving a quarter to a third of the prize pool, depending on entrants.
- Rebuy and add-on options affect the final prize pool, which is calculated by subtracting rake from gross receipts and adding rebuys, with overlay risk needing budgeting.
- Common payout structures include top-heavy, flat, standard, and winner-take-all, which influence player behavior and tournament dynamics differently.
- Using an ICM calculator during the bubble phase helps ensure fair chip-to-dollar conversions, especially near the payout cutoff.
- Automated payout calculators and clear published structures prevent errors and disputes, supporting transparency and compliance with local gaming laws.
Table of Contents
- What makes up a poker tournament payout structure
- Which payout structure suits your event?
- How do you calculate poker tournament payouts step by step?
- How many places should you actually pay?
- How does ICM change strategy near the bubble?
- Do calculators and apps really cut down payout errors?
- What should be on your Tournament Director payout checklist?
- What legal and regulatory rules affect payout structures?
- How does payout shape affect player psychology at the table?
- Do online and live tournaments pay out differently?
- What exactly counts as the min-cash and the bubble?
- What do experienced organisers get wrong most often?
- Let Shuffle Up and Deal! handle the payout maths for you
- Where to check the numbers and build your own payout sheet
- Sources
What makes up a poker tournament payout structure
A payout structure only works once you know exactly what’s going into the pot. Start with gross receipts: multiply the number of entrants by the buy-in. That’s your headline figure, but it isn’t the number you’re paying out.
From gross receipts, subtract the rake or house fee. Home games might run rake-free, but card rooms and casinos typically hold back a percentage to cover dealers, the room, and staff. Whatever is left is your actual prize pool, and this is the figure your payout percentages apply to, not the gross entry total.
Rebuys and re-entries complicate things in a good way. Each one adds fresh money to the pool, so if your tournament allows unlimited rebuys during the first hour, you need to keep a running total rather than fixing the pool at the start. Guarantees work the other way. If you promise a $5,000 prize pool and only sell $3,800 in entries, you’re covering a $1,200 overlay out of your own pocket, and that needs to be budgeted for before you advertise the guarantee.
A few figures are worth memorising before you set a structure:
- Percentage of field paid: 10% to 15% is the industry norm for most tournaments.
- Min-cash threshold: typically 1.5 to 2 times the buy-in for the last paid spot.
- Prize pool formula: (entrants × buy-in) + rebuys − rake = prize pool.
- **Overlay risk: any gap between a guarantee and actual entries comes from the house or organiser, not the players.
Which payout structure suits your event?
Four shapes cover almost every poker tournament payout you’ll ever build, and each one changes how your players behave at the table.
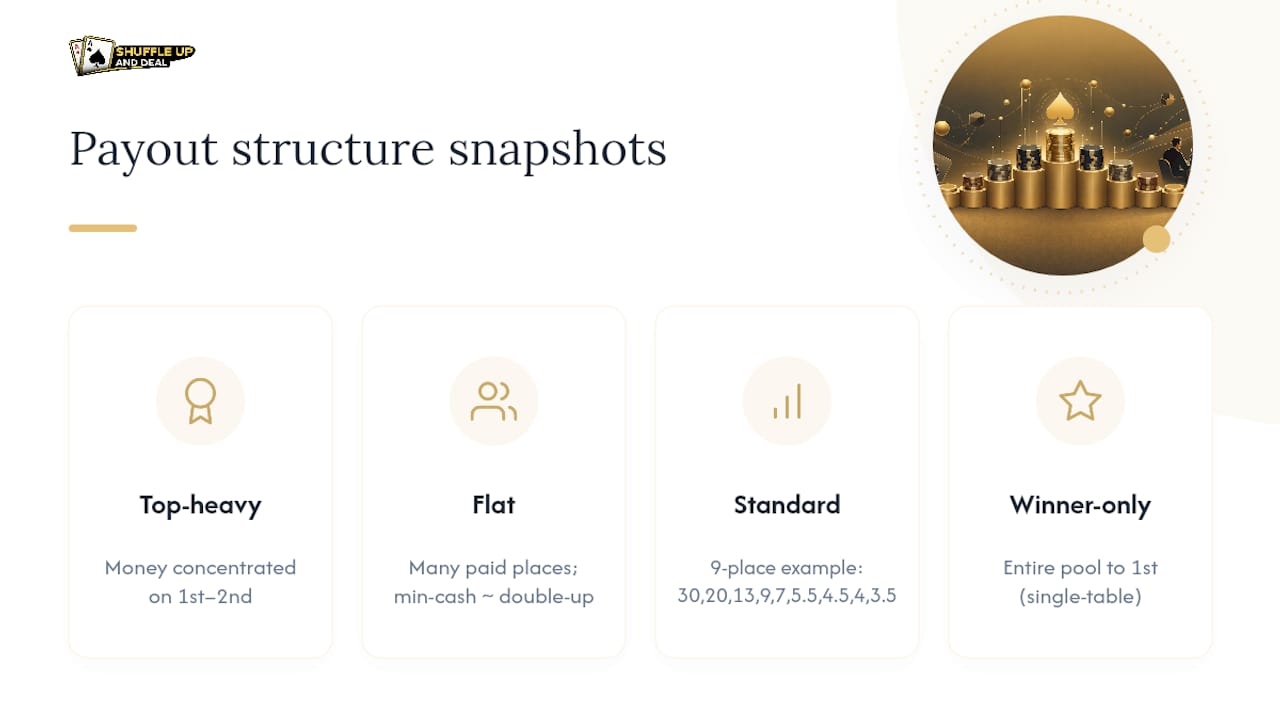
Top-heavy structures concentrate the money at first and second place, sometimes leaving the min-cash barely above break-even. They suit high-roller events and satellites where players want a shot at a big score and accept higher variance in exchange. Flat structures spread the pool more evenly across paid places, so min-cash pays close to a double-up rather than a fraction of it. Charity nights and casual leagues favour this shape because nobody wants a room full of deflated players who “cashed” for less than their buy-in felt worth. Standard/stepped curves sit in between: a clear winner’s share, a gradual step down, and a respectable min-cash. This is the default most public calculators load first. Winner-take-all does exactly what it says, and it’s really only sensible for very small single-table events or heads-up formats where splitting the pool would be almost meaningless anyway.
Published percentage tables give you a sense of how these curves actually play out. A representative nine-handed final table runs first at 30%, second at 20%, third at 13%, fourth at 9%, fifth at 7%, sixth at 5.5%, seventh at 4.5%, eighth at 4%, and ninth at 3.5%.
For home games and league nights, a flat curve or the 50/30/20 single-table split keeps things friendly. For high-roller or knockout-style events, lean top-heavy and let the bounties or side pots do some of the flattening for you, particularly if you’re running a mystery bounty format where bounty payouts sit alongside the standard prize pool.
How do you calculate poker tournament payouts step by step?
The maths behind any payout structure poker organisers use boils down to four repeatable steps, whether you’re running a ten-player home game or a hundred-player weekly.
- Calculate the prize pool. Multiply entrants by buy-in, add any rebuys or add-ons, then subtract rake or host fee.
- Choose your percent-of-field and curve. Decide how many places get paid (10% to 15% is standard) and pick a top-heavy, flat, or standard shape.
- Multiply and round. Apply each place’s percentage to the prize pool, then round to a sensible denomination, usually the nearest £5 or £10 depending on your chip and cash denominations.
- Adjust for late changes. If rebuys or a guarantee overlay shift the final pool, recalculate before you print the sheet, and announce any change immediately rather than letting rumours spread at the table.
Here’s how that plays out across three common field sizes:
| Field size | Buy-in | Prize pool | Paid places | 1st place payout |
|---|---|---|---|---|
| 10 players (STT) | $50 | $500 | 3 | $1,350 |
| 50 players | $100 | $4,500 (after 10% rake) | 5 | $1,350 (30%) |
| 100 players | $900 | $4,500 (after 10% rake) | 12 | $3,375 (30%) |
Take the 50-player example: 50 entrants at $100 gives $5,000 gross, rake at 10% removes $500, leaving a $4,500 pool. Pay six places on a standard curve (30/20/14/12/12/12, adjusted to taste), and first place clears $1,350. Round the smallest payouts to whole pounds or dollars so cashiers aren’t fumbling for coins, and if the total after rounding doesn’t quite match the pool, add or subtract a pound or two from the min-cash spot rather than the winner’s share. Calculators such as the payout calculator on PokerCharts do this rounding automatically once you’ve entered your buy-in, rake, and expected entrants.
How many places should you actually pay?
Converting a percentage policy into a real number of paid spots is where a lot of organisers hesitate, so here’s the shorthand that most established guides converge on.
- Small fields (2 to 10 players): pay the top 3, following the classic 50/30/20 single-table split.
- Medium fields (11 to 30 players): pay 4 to 5 places, which usually lands close to 15% to 20% of the field.
- Large fields (30 to 100+ players): pay the final table, or roughly 10% to 15% of entrants, whichever gives the rounder number.
The quick formula is: paid spots = entrants × target percentage, rounded to the nearest whole number. A 73-runner field at a 12% target gives you 8.76, so you’d pay 9.
Pay too few spots and you concentrate risk so heavily that recreational players feel like they’re buying a lottery ticket rather than entering a game of skill. Pay too many and the min-cash shrinks to the point where cashing barely feels different from busting, which quietly kills the incentive to play carefully near the bubble.
How does ICM change strategy near the bubble?
The Independent Chip Model converts chip stacks into real dollar equity, and it’s the reason doubling your chips never doubles what you’re actually worth in payout terms. A player with 20% of the chips in play is worth less than 20% of the remaining prize pool once you account for the fact that they could still bust before the money. This effect is sharpest right before the bubble bursts, when the gap between the last unpaid spot and the min-cash makes short stacks desperate to fold and big stacks desperate to apply pressure.
Top-heavy structures amplify this: with a huge gap between min-cash and first, players near the bubble tighten up hard, since the marginal value of surviving into the money outweighs a modest chip gain. Flat structures dull the effect, since min-cash and a deeper run pay similarly, so players keep playing closer to their normal ranges.
As a TD, you’ll also field chop requests once a final table gets short-handed. Allow them, but insist on an ICM-based calculation rather than an even split, and get every remaining player’s signature before you pay out.
Pro Tip: Use an ICM calculator to show players the numbers before they agree to a chop. A deal that “feels fair” by chip count is often lopsided in real dollar terms, and showing the maths avoids arguments afterwards.
Do calculators and apps really cut down payout errors?
Public calculators exist precisely because manual payout maths is where organisers make expensive mistakes. Most offer the same core toolkit:
- Rake toggles and buy-in fields, so the prize pool updates automatically as entries come in.
- Preset curves (standard, top-heavy, flat), plus a custom option for house-specific structures.
- Printable payout sheets you can post at registration or hand to the cashier.
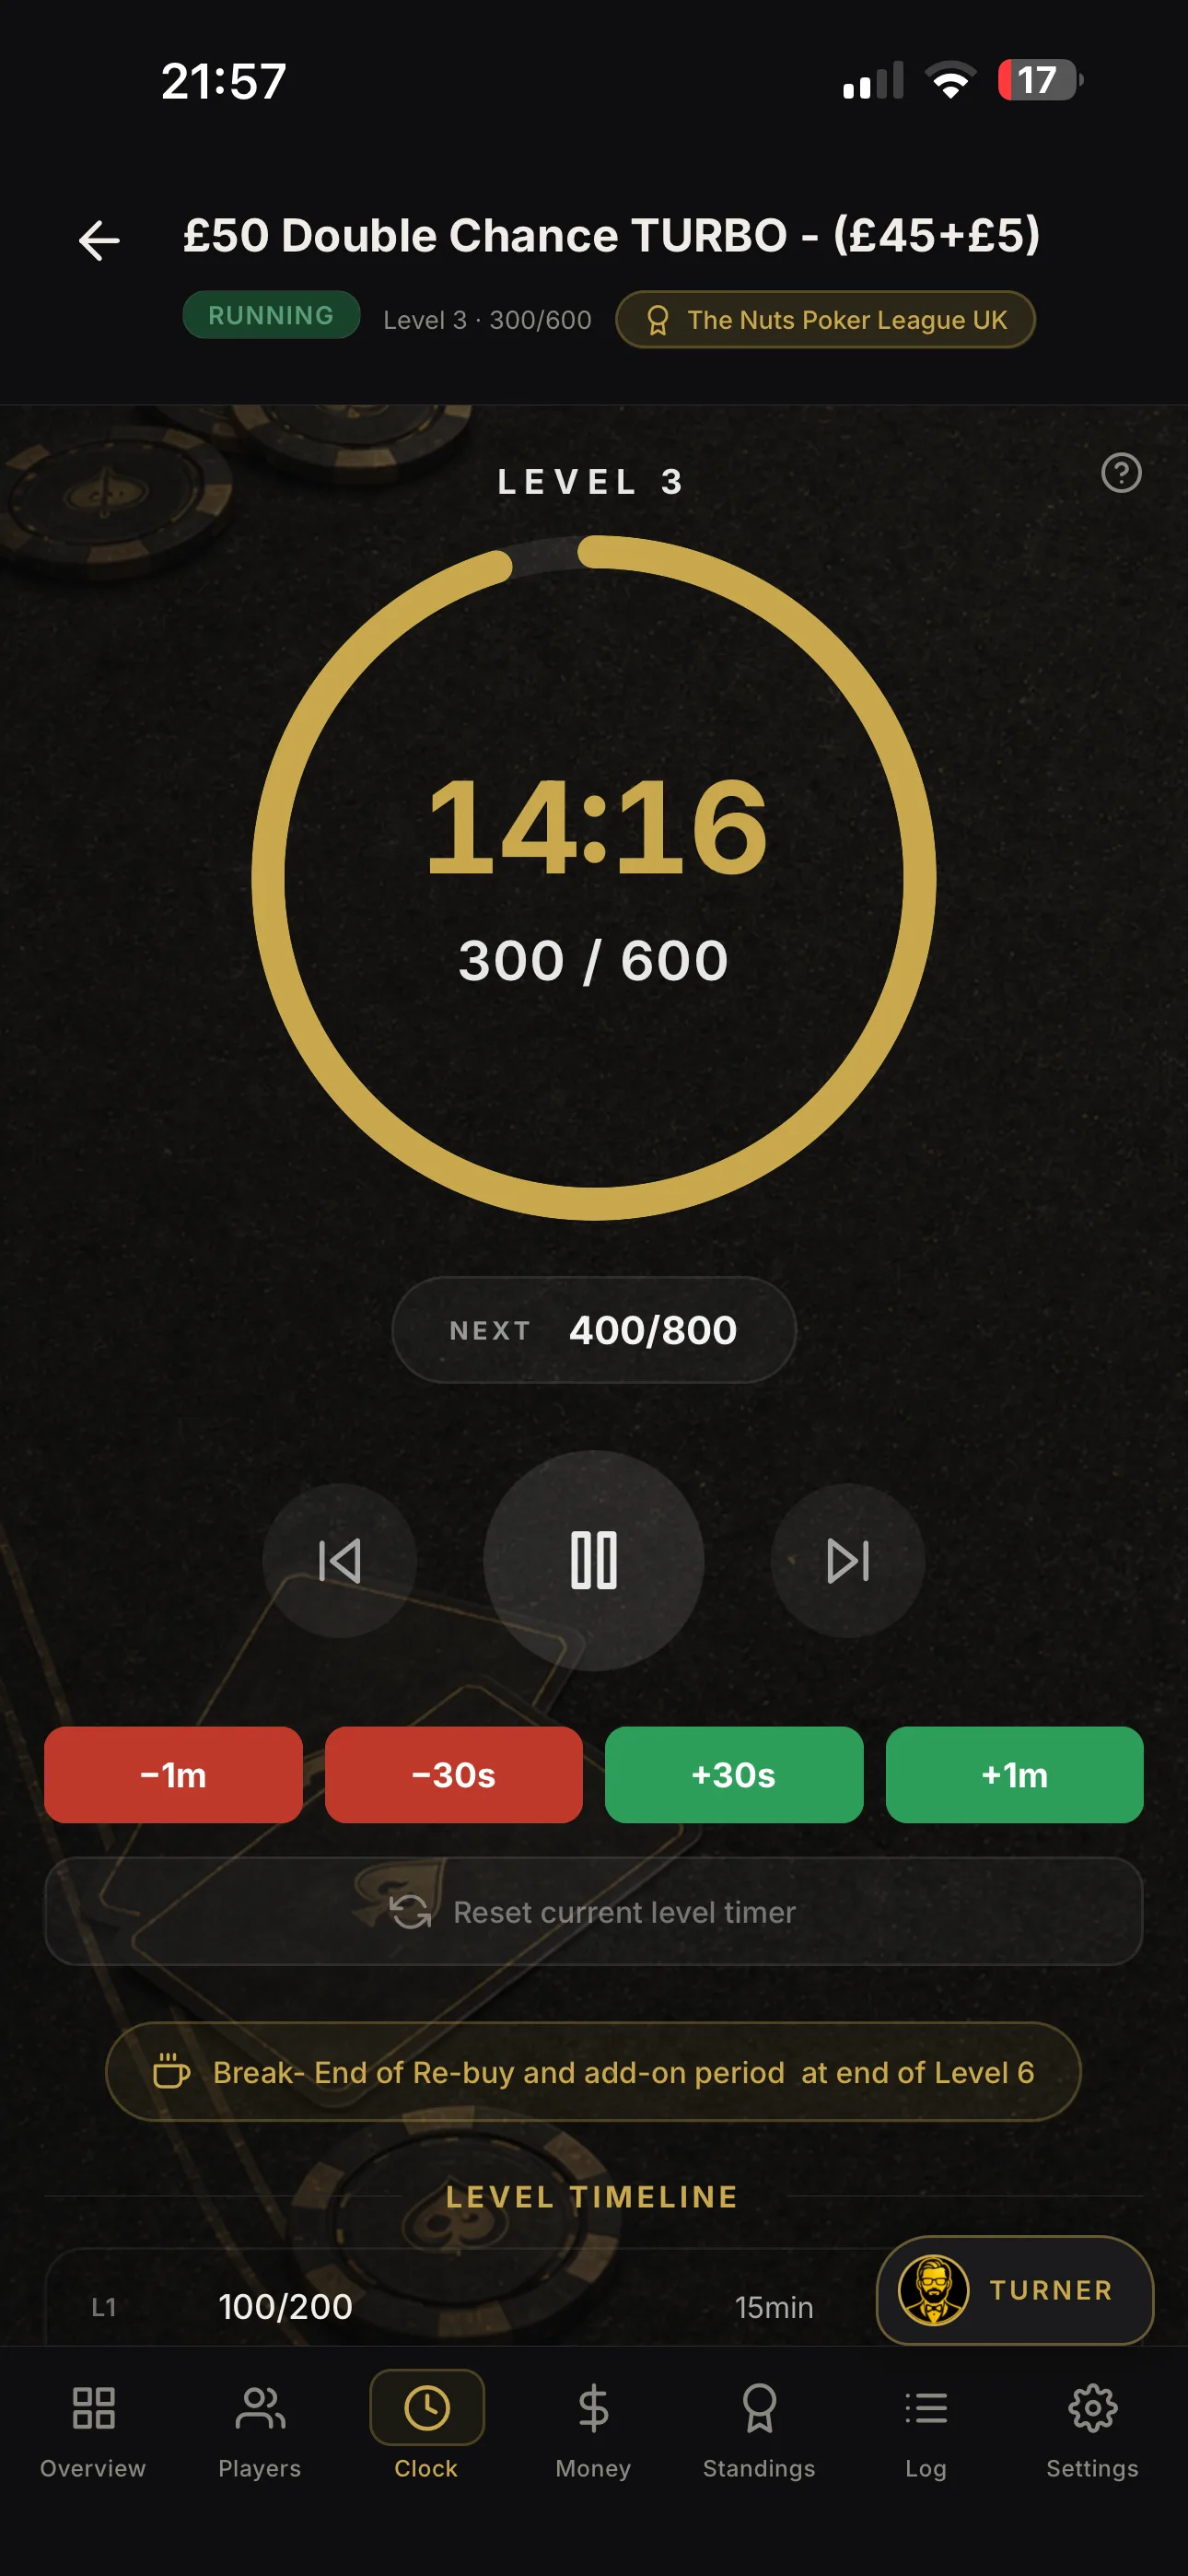
Shuffle Up and Deal! builds these same functions directly into live tournament management rather than treating them as a separate spreadsheet step. Its in-app payout calculator tracks the prize pool in real time as players register, rebuy, or late-register, so the numbers you announce at the start of the day stay accurate right through to the final table. Printable and shareable payout sheets mean players can check the structure from their phone via a live link, and multi-event management lets you run these calculations across several tables or festivals at once without losing track of which pool belongs to which flight.
What should be on your Tournament Director payout checklist?
- Announce the buy-in and rake split before registration opens, not after the first bust-out.
- Publish the payout curve and paid-spot count where every player can see it.
- Recalculate and re-announce immediately if rebuys, add-ons, or a guarantee overlay change the pool.
- Round payouts to sensible denominations, adjusting the smallest paid spot rather than the winner’s share.
- Document any chop with signatures and keep a copy for disputes.
A printable template needs just seven fields: buy-in, rake, entrants, prize pool, paid spots, curve used, and a contact name for disputes.
Pro Tip: Keep a laminated or digital copy of last week’s payout sheet on hand. When a player asks “why did I only get X”, pointing at a published, dated structure ends the conversation far faster than doing the maths from memory.
What legal and regulatory rules affect payout structures?
Payout rules don’t exist in a vacuum, and the legal picture varies enormously depending on where you’re running your event and what kind of money is involved. Home games with modest stakes and no house cut sit in a different category almost everywhere compared with a card room taking rake, and the line between the two is usually drawn by local gambling legislation rather than by poker convention.
Licensed card rooms and casinos typically operate under a gaming authority that mandates published structures, audited rake percentages, and clear disclosure of any house fee taken from the prize pool. Charity poker nights face their own layer of rules in many jurisdictions, since gaming regulators often treat “prizes funded by entry fees” as a form of gambling requiring a permit, even when the organiser calls it a donation-based event. Online operators face similar scrutiny, with regulators in several markets requiring real-time disclosure of rake and guarantee overlays before players register.
None of this should discourage you from running a tournament, but it does mean checking your local rules before publishing a structure, particularly around guaranteed prize pools, because promising a guarantee you can’t legally cover (whether through overlay or through prohibited house contributions) can create liability beyond a simply unhappy player base. If you’re running anything beyond a private home game, a quick conversation with your venue or a local gaming authority is worth far more than guessing.
How does payout shape affect player psychology at the table?
The shape of your payout curve does more than decide who gets what. It quietly rewires how people play from the first hand.

A steep top-heavy curve creates what feels like lottery energy. Players know min-cash barely covers their buy-in, so many push for the big prize rather than nursing a stack into a min-cash finish, which tends to produce faster eliminations and looser play early on. That’s not a flaw if you’re running a high-roller event where big swings are the point, but it can frustrate recreational fields who expected a more measured grind. Flat structures do the opposite: because min-cash pays close to a real return, players tighten up and protect their stacks for longer, which extends the tournament but often produces a more skill-rewarding bubble phase.
There’s a psychological cliff effect too, separate from ICM’s dollar mechanics. Players sitting one spot outside the money often play radically tighter than pure equity calculations suggest they should, purely because busting before the bubble feels worse than busting after it, even when the chip difference is trivial. Organisers who understand this can use it deliberately: extending the bubble slightly with a well-placed break, for instance, gives short stacks a beat to reset rather than tilting into a bad call. None of this is guesswork once you’ve watched a few final tables. It’s a repeatable pattern that shows up in home games and $10,000 buy-ins alike, just at different emotional volumes.
Do online and live tournaments pay out differently?
The core maths of a poker tournament payout structure doesn’t change between felt and screen, but the operational details often do. Online platforms process rebuys, late registration, and payout distribution instantly and automatically, so the prize pool figure displayed to players updates in real time with no manual recalculation. Live events depend on a Tournament Director doing that maths by hand or with a calculator, which introduces a lag between a rebuy happening and the published pool reflecting it.
Live events, where payouts are often handed out in cash at a cage or table, face a practical ceiling on how many places are worth paying, since printing and counting fifty different cash amounts is a genuine logistical burden a spreadsheet doesn’t have to worry about.
Rake structures diverge too. Online rake is usually a fixed, transparent percentage disclosed at the table before you register. Live rake can include additional dealer tips, staff gratuities, or venue fees layered on top of the house cut, which is part of why live organisers benefit so much from publishing a clear buy-in and rake breakdown before the first hand is dealt. Neither format is inherently fairer, but live organisers carry more of the calculation burden manually unless they’re using dedicated tournament software to close that gap.
What exactly counts as the min-cash and the bubble?
Min-cash is the smallest payout awarded, typically to the last paid place, and it sets the emotional baseline for the whole field. A min-cash pegged at 1.5 to 2 times the buy-in feels like a genuine reward. Anything closer to breakeven risks feeling like a consolation prize, and players notice the difference even if the exact percentage rarely gets discussed openly at the table.
The bubble is the stretch immediately before that min-cash threshold, usually the period where one or two more eliminations will put every remaining player into the money. It’s the single most psychologically charged phase of any tournament, live or online, because the gap between busting one spot short of the money and cashing can represent a bigger swing in player satisfaction than several places further up the payout ladder. Short stacks near the bubble often shift into pure survival mode, folding hands they’d normally play, while bigger stacks lean into that pressure by widening their raising ranges to attack the tighter players.
Organisers can smooth this transition by choosing a curve where the step from the first unpaid place to the min-cash isn’t jarring, and by giving clear, visible updates on how close the field is to the money. A published payout sheet, visible on a shared screen or live tournament display, removes the guesswork that otherwise fuels bubble anxiety and keeps players focused on their decisions rather than mental arithmetic about how many eliminations are left.

What do experienced organisers get wrong most often?
The two mistakes I see repeated constantly are undisclosed rake and changing the payout curve mid-event. Both erode trust instantly, and both are entirely avoidable with a published structure and a bit of discipline. Get the buy-in, rake, and curve on paper before Level 1, and most payout disputes simply never happen.
- Jason
Let Shuffle Up and Deal! handle the payout maths for you
Shuffle Up and Deal! is the alternative to spreadsheets and mental arithmetic for anyone running a poker tournament payout structure with real money on the line. Its in-app payout calculator tracks your prize pool live as players register, rebuy, or add on, so you’re never announcing a figure that’s already gone stale by the next elimination.

Beyond the calculator itself, printable and shareable payout sheets mean your players can check the structure from their own phones rather than crowding round a clipboard, and rebuy and late-registration handling updates the pool automatically the moment new money comes in. Running several tables or a multi-flight festival? Multi-event management keeps every pool separate and accurate without you juggling separate spreadsheets. There’s a free forever plan to start with, so you can trial the payout calculator on your next event before deciding whether you need the expanded tiers. Head to Shuffle Up and Deal! and set up your first tournament structure today.
Where to check the numbers and build your own payout sheet
- PokerStrategy’s payout structure glossary: a clear reference for standard percentage-of-field and min-cash norms.
- RiverOdds’ payout structure guide: worked percentage tables across various field sizes.
- PokerCharts’ payout calculator: build and print a custom curve in minutes.
- Poker Game Database’s payout calculator: useful for modelling rake and rebuy scenarios.
- Manny’s Variety Picks on bankroll management: sound advice for players sizing their buy-ins sensibly.
Sources
- All You Need to Know About Payout Structure - PokerStrategy
- Poker payout structure - RiverOdds
- Tournament payout calculator - PokerCharts
- Poker Tournament Payout Structure (2026) - Beasts of Poker